
OVERALL:
After more than one false alarm, Minnesota is officially in its second wave of covid-19.
I told you many times over the summer not to worry about media-hyped “record-breaking case counts”; case counts were increasing because testing was increasing. Not this time. This one’s real.
Minnesota likely has more actual infections than it ever has before. It definitely has more hospitalizations. It may soon have more deaths.
You should take appropriate precautions. Tighten your social graph back up. Reduce shopping trips. If you started meeting with friends indoors who are not in your bubble, time to stop. If you started working from the office again and can return to working from home, make an excuse to do so for the next few weeks.
More on this at the end. First, let’s survey the situation.
DETAIL:
Basically, we have a lot of cases, even after you account for increased testing. Like so:
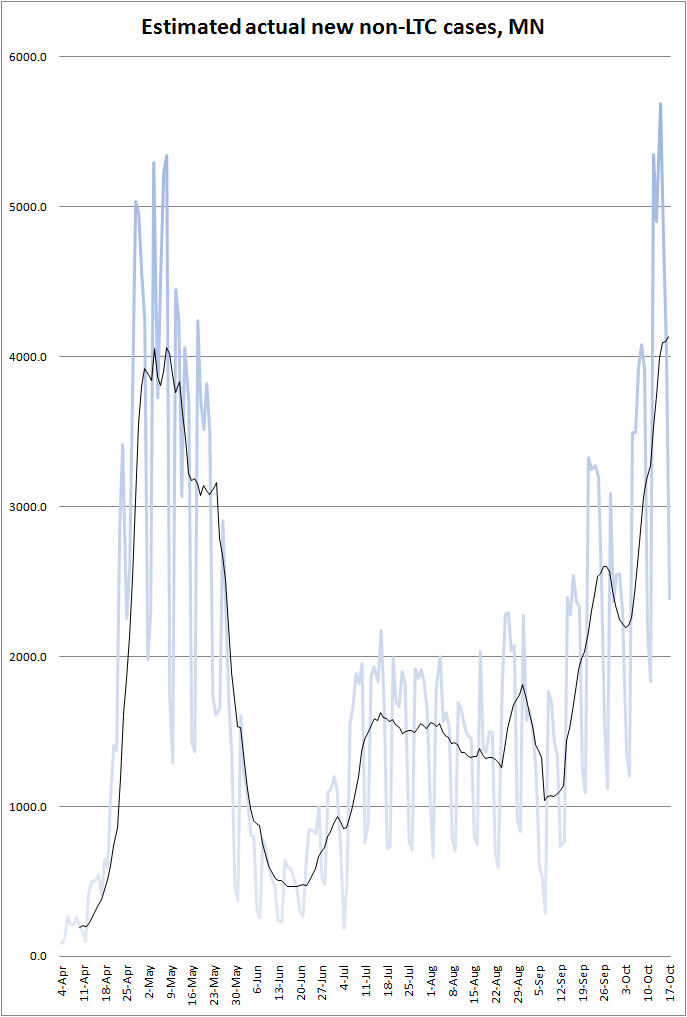
This data lags by seven days. “LTC” is short for “long-term care” (basically, nursing homes).
If there’s good news this week, it’s that cases are not rising nearly as quickly in nursing homes as in the general population:
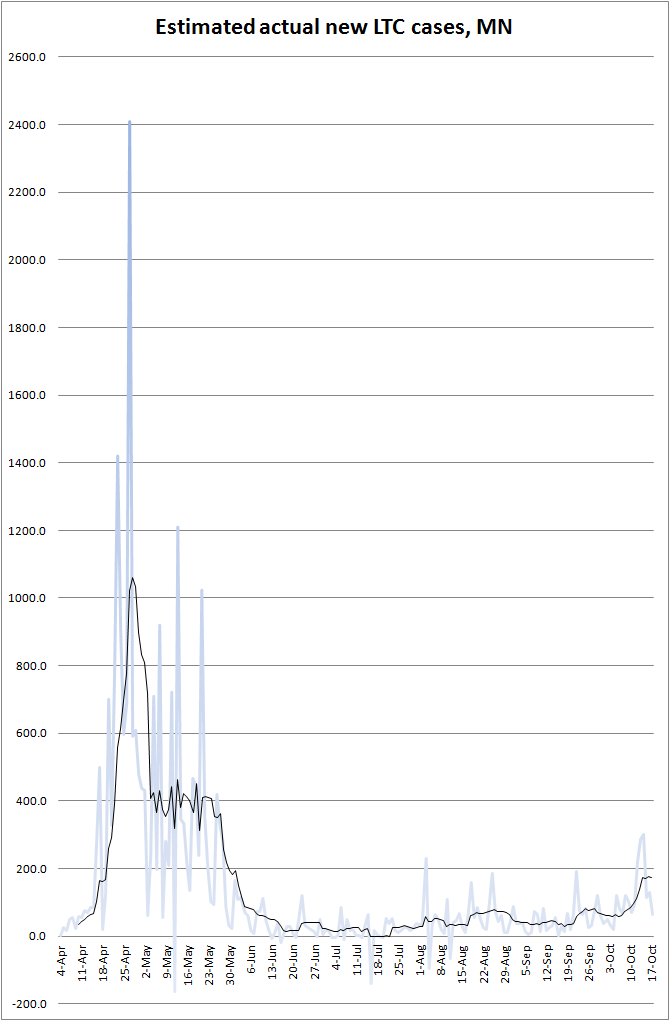
Cases are still rising in long-term care homes — and that spike has killed a bunch of old people — but we’ve managed so far to keep it from getting out of control in nursing homes (unlike in April).
As I state every week, my daily estimate of “actual new cases” is derived by taking the current 7-day average positivity rate, dividing it by 2% to yield a multiplication factor (minimum 1.0), and multiplying the officially reported non-LTC cases by that factor. (This estimate assumes test positivity rates between LTCFs and the general population are more or less the same.) This is crude enough that, when positivity is significantly above 2%, the precise numbers may be way off… but it should be accurate enough for us to trust the trendline.
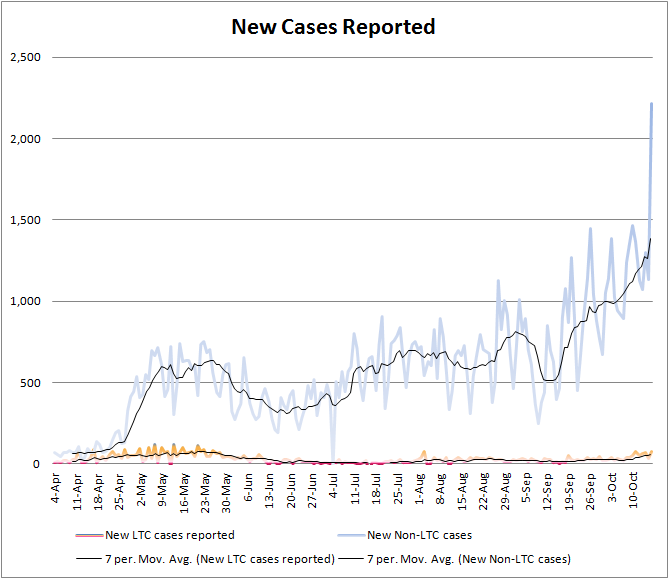
Here is the raw, official state data I use to build these estimates:
Our testing capacity continues to grow, but, in the past two weeks, the huge growth in cases has outpaced the growth in testing:
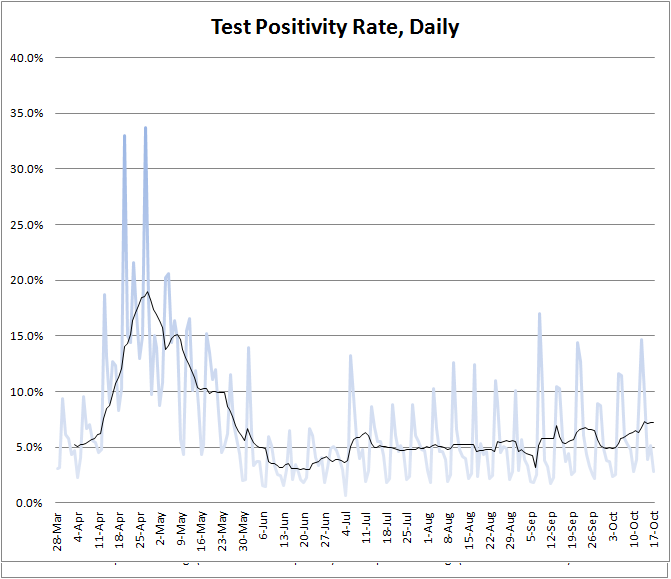
We are way outside the 2% “safe zone.” We are now also outside the 5% “good enough zone.” That means we are missing more cases. My case estimates at the top attempt to account for that, but, as positivity rises, we become increasingly blind to the spread of the infection, and my estimate (like everyone else’s) becomes less certain.
As I noted at the top, all this data lags by 7 days.
“But, James, that’s just cases. Lots more young people are getting it now and having mild cases that don’t require hospitalization! It’s okay!”
There’s some truth to that — but not enough. Hospitalizations are at an all-epidemic high:
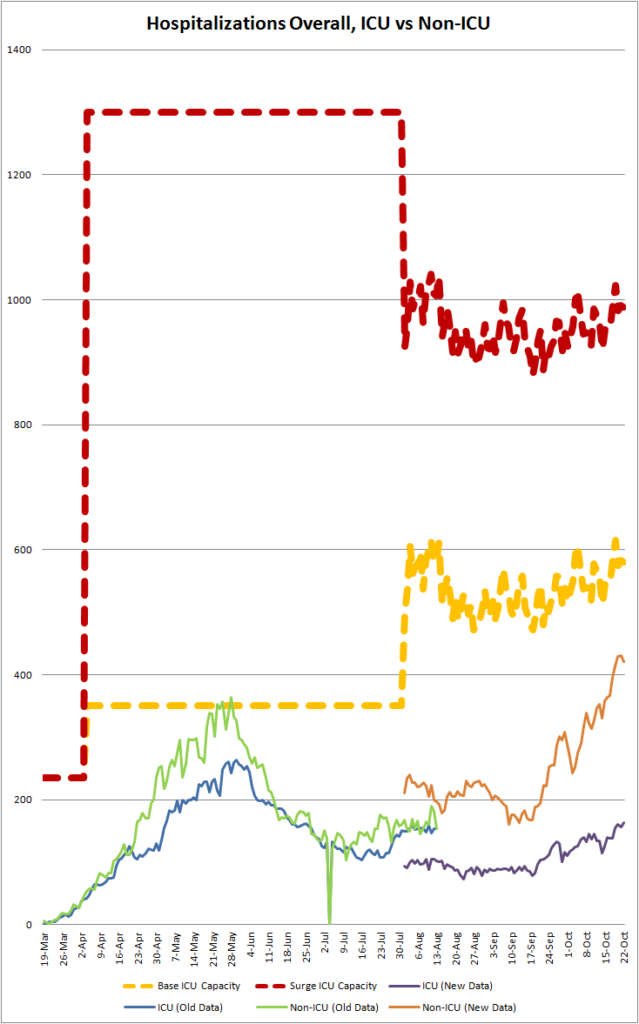
The good news: we do still have plenty of hospital beds. Even at our current rapid clip, even if things get somewhat worse than they are now, we are still at least several months away from exhausting our ICU capacity. (And we have around 3,000 free non-ICU beds, too many to even put on this chart.)
The bad news: they’ve never been this full, and they’re still getting fuller at a very quick clip:
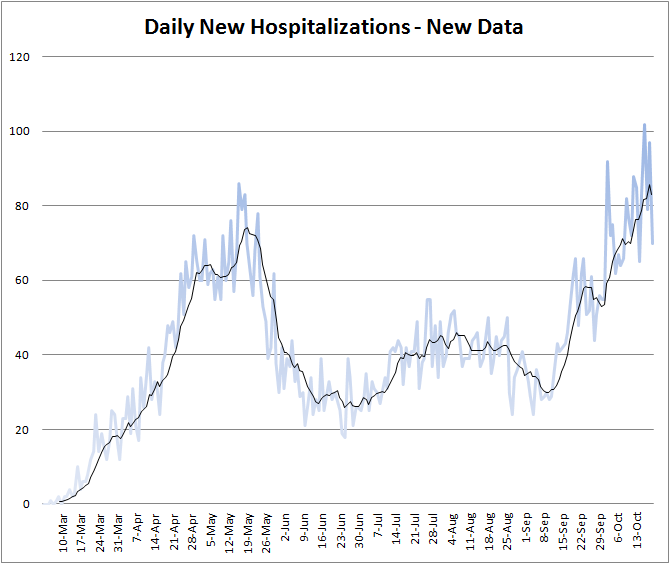
Both hospitalization charts mentions “new data.” That is because of last month’s switch in how Minnesota reports hospitalization data. As you can see, there’s a significant gap between how many beds were counted as occupied under the old method compared to the new method. But, however you slice it, it appears that our hospitals are under significant strain right now.
And, at last, we’re starting to see this wave show up in the death stats:
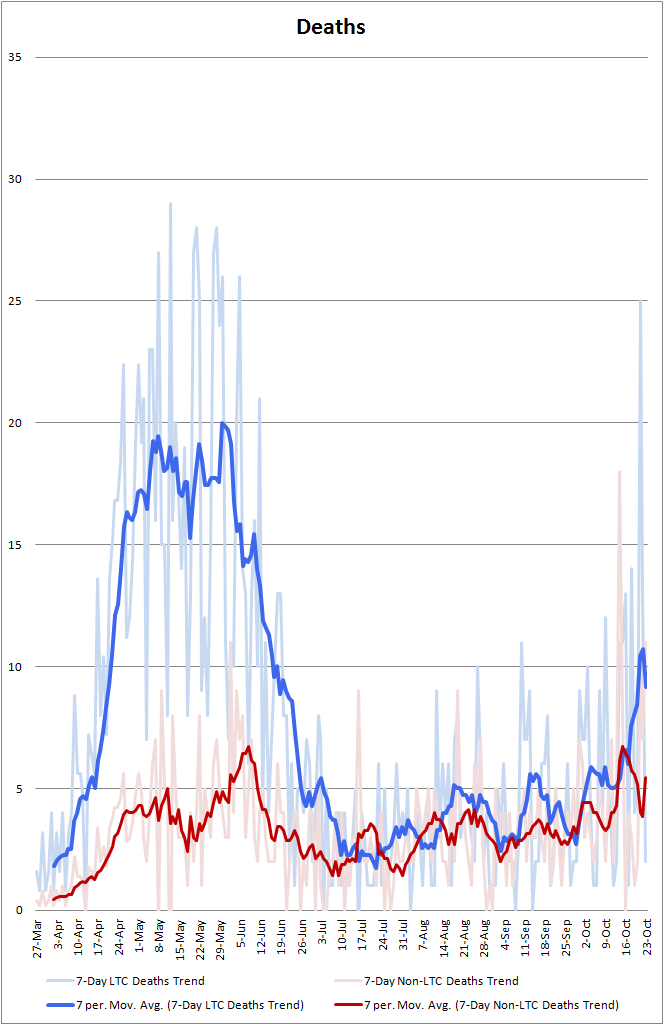
Even that relatively small outbreak in nursing homes is killing a lot of old people. Meanwhile, for everyone else, deaths have never been higher. We may reasonably expect this to get worse before it gets better.
I have some hope based on recent studies which show covid mortality rates falling (presumably due to better treatments, although there are other possible causes). I don’t think it’s going to get as bad as the Minnesota Model projected, but it’s not going to be fun, either.
WHY A SURGE?
I talked about this last time, and I stand by what I said then, with one small addition: back when summer started, I offered the suggestion that covid was going into remission because it transmitted poorly in summer weather, especially with most Minnesotans interacting outdoors.
I can’t help noticing that our spike arrived just as fall settled in, the weather chilled, and people started to move inside.
WHAT TO DO
These waves do not last forever. That’s one thing we’ve learned in the past few months. Arizona had a horrible six weeks early in summer… and then it ended. Louisiana got it really bad later in summer, again for about six weeks… and then it got better. California’s ugly period lasted about eight weeks… but now it’s better. So you don’t need to cancel your life, but it’s time to take extra precautions.
In other “it won’t last forever” news, we are getting close to a vaccine. And, sure, yeah, you, Joe Public, aren’t going to be offered the covid vaccine for a long, long time, because production will be slow… but, once the high-risk people get it, the worst risks from this pandemic will be over. That day seems to be only a few months away. Yes, covid is around six times deadlier than the flu, but, for most of us outside high-risk groups, six times basically nothing is still basically nothing. For this reason, I don’t anticipate a third wave of covid in Minnesota; I expect the pandemic to be (for all intents and purposes) over before another wave has time to build.
But, here and now, this thing is still raging through a population full of high-risk people, faster than it ever has before. You should take sensible precautions, especially if you or someone close to you is high-risk. If you were planning a big family Thanksgiving with 50 people, this is a good time to figure out how to get that number down to 10. You should keep socializing outdoors when possible, even as it gets chilly. (Maybe a good time to buy an outdoor heater?) We’re still planning to do trick-or-treating, but I’d be remiss if I didn’t tell you that the CDC advises against it. And we’ll be masked up and maintaining distance from people — our spooky candy chute is all ready to go, so we don’t have to get close to the little tykes.
I’ve been taking my family to (short, daily, songless) Mass lately, and advising others in my life to do the same. Now that we’re in a wave, I think I will advise higher-risk people to head back to TV Mass for a few weeks, and others to redouble their social distancing efforts.
I won’t pull my daughter out of school — they’ve done a wonderful job with social distancing, and the costs of remote learning are very large — but, as soon as the school gets a case (which seems inevitable at this rate), I’ll cut ties with my parents and everybody else for a couple of weeks.
Basically, I’m taking everything from the “Acceptably Risky” column in my risk table from a few months ago and moving it to the “Too Risky” column until this wave is over.
The government may very well take additional action, and that action may very well be justified. I wouldn’t eat indoors at a restaurant right now if you paid me. I would not be at all surprised to see eateries closed again for indoor seating, especially if the federal government passes (much-needed) debt-financed relief for small businesses. Continue supporting your local restaurants, especially non-chains (but many chains are hurting, too!) through generous use of the take-out window and ridiculously nice tips.
I do not anticipate another lockdown, because evidence does not seem to indicate that lockdowns are very effective at slowing the spread. (I’ll blog about that later, possibly when this is all over. As an April/May lockdown supporter, I need to publicly come to grips with what I was wrong about.) Broad-spectrum lockdowns, at this point, appear to be more about political theatre than about public health. I don’t see Gov. Walz doing that in Minnesota at this time. This is a blue state, but it ain’t New York.
SELECTED GROWTH RATES
Average week-over-week growth in estimated cases, July 30th-Aug 6th: 3%
Sep 4th-10th: -9%
Sep 11th-17th: -15%
Sep 18th-24th: 50%
Sep 25th-Oct 1st: 29%
Oct 2nd-Oct 8th: -6%
Oct 9th-Oct 15th: 26%
Oct 16th-Oct 22nd (preliminary; will grow): 29%
All data is either directly from here or derived from data from here: Minnesota Department of Health: Situation Update for Covid-19 . I went into a little more detail on some of these data in my post Covid Takes A Breather a few months ago. And I finally uploaded my giant Excel worksheet to Google Sheets so you can see the raw numbers and calculations I am doing. Fair warning, though: I did absolutely nothing to clean it up. It’s a mess. Please enjoy Reinhart-n-Rogoffing me.